
The Productivity Clock
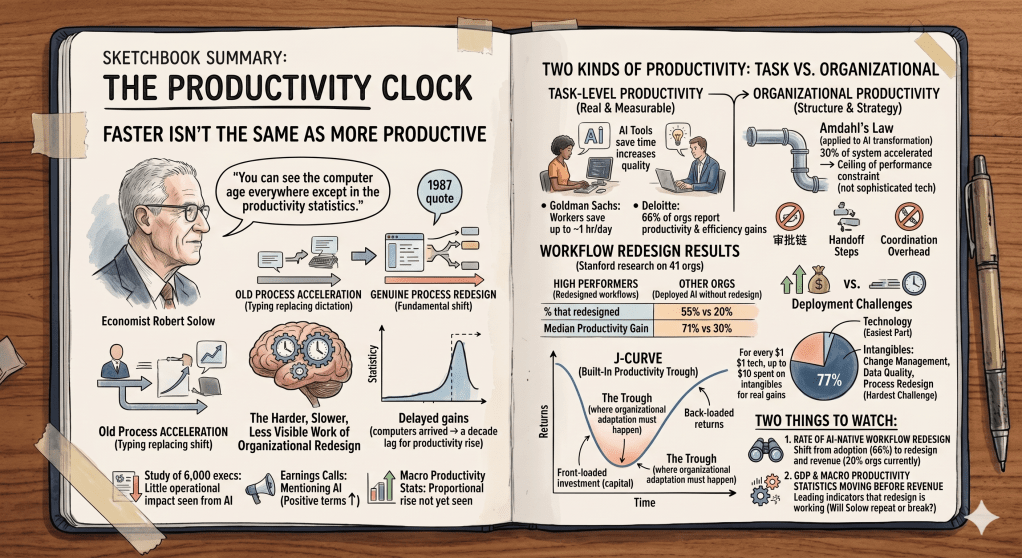
In 1987, economist Robert Solow made an observation that became one of the most quoted lines in technology economics: “You can see the computer age everywhere except in the productivity statistics.”
It took roughly a decade for that to change. Computers had arrived. Organizations were using them. Productivity, at the macro level, was not moving. The explanation, when it finally arrived, wasn’t that computers didn’t work. It was that organizations hadn’t yet redesigned around them. They had accelerated existing workflows instead of questioning whether those workflows were the right ones. The gains eventually came, but only after the harder, slower, less visible work of organizational redesign caught up with the technology.
History appears to be repeating. A study of 6,000 executives found that the vast majority see little operational impact from AI despite broad adoption. S&P 500 companies are mentioning AI in nearly every earnings call and describing implementation in positive terms. The macro productivity statistics are not yet moving in proportion to the investment. Economists are explicitly resurrecting the Solow paradox to describe what they’re seeing.
This is not a coincidence. It is a pattern. And understanding why it’s happening is more useful than being surprised by it.
Two Kinds of Productivity
The conversation about AI productivity conflates two things that need to be kept separate: task-level productivity and organizational productivity.
Task-level productivity is real and measurable. Goldman Sachs found that AI is saving workers up to an hour a day. Deloitte’s research finds 66% of organizations reporting productivity and efficiency gains. Individual workers are completing specific tasks faster, with better output quality, across a wide range of roles. That is not in dispute.
Organizational productivity is something different. It means more revenue per employee. Better margins. Measurable improvements in customer outcomes at the business unit level. It’s what happens when task-level gains compound into something that shows up on the income statement. And here the data tells a different story: only 20% of organizations report revenue growth from AI, even among the 66% seeing productivity gains.
That gap isn’t an anomaly. It’s structural.
The reason task-level gains don’t automatically become organizational productivity comes down to a principle from computer science that applies with uncomfortable precision to enterprise AI: Amdahl’s Law.
Gene Amdahl’s 1967 insight established that the performance improvement of any system is ultimately limited by the portion that cannot be enhanced. If only 30% of your system can be accelerated, even perfect optimization of that portion will never improve overall performance by more than 43%. The constraint determines the ceiling, regardless of how dramatically you improve other components.
Applied to AI transformation, this means that “transformational success is constrained by the organizational and strategic elements that remain unchanged, not determined by the sophistication of the technology we implement.” The AI tool accelerates the portion of the workflow it touches. Everything it doesn’t touch, the approval chains, the coordination overhead, the handoff steps, the process structures built around older constraints, stays exactly as it was. Speeding up 30% of a workflow that wasn’t designed for speed doesn’t produce a fundamentally more productive organization. It produces a slightly faster version of the same output, absorbed by a system that wasn’t built to compound it.
Most enterprise AI deployments are running directly into this ceiling without realizing it. The technology is performing. The workflow constraint is limiting. And because the constraint is organizational rather than technical, it doesn’t show up in product evaluations or adoption metrics. It shows up later, in revenue lines that don’t move despite productivity dashboards that look healthy.
The Stanford Digital Economy Lab’s Enterprise AI Playbook, examining 51 AI deployments across 41 organizations, makes this explicit. High performers, defined by business outcome measures rather than adoption rates, were nearly three times more likely to have fundamentally redesigned workflows as part of their AI efforts: 55% of high performers redesigned workflows versus 20% of other organizations. That redesign produced a median productivity gain of 71%. Organizations that deployed AI without redesigning workflows saw gains of 30%. Same technology. Radically different outcomes. The difference was whether the organization questioned its own process or just made it faster.
You can’t compound your way to organizational productivity by making the wrong process faster.
Why the J-Curve Is Built In
The productivity trough isn’t a failure of implementation. It’s a predictable structural consequence of how this technology was sequenced.
The capital was deployed before use cases were proven at scale. The tools arrived before organizations had developed the knowledge, the fluency, or the institutional permission to redesign around them. The Stanford research quantifies the imbalance: for every dollar of tangible technology investment, organizations that achieve real productivity gains spend up to ten dollars on intangibles: process redesign, reskilling, change management, and organizational transformation. That intangible investment is what converts tool adoption into business outcome. It’s also what most organizations have systematically underbudgeted.
The result is a J-curve that was baked in from the beginning. Investment front-loaded. Returns back-loaded. The trough in between isn’t a sign that AI doesn’t work. It’s the period where the organizational adaptation work has to happen before the returns can materialize. And that work is slower, less visible, and more expensive than buying the technology.
77% of the hardest challenges organizations face in AI deployment are intangible: change management, data quality, process redesign. The technology itself is consistently described as the easiest part. The industry has been selling the easy part and underestimating the hard part, which means most organizations walked into their AI deployments structurally underequipped for the work that actually determines whether they see returns.
The Solow Precedent, Revisited
The historical comparison isn’t perfect, but it’s instructive.
When computers proliferated through the 1980s, organizations adopted the technology without redesigning around it. Typing replaced dictation. Spreadsheets replaced ledger books. The same work got done faster. Macro productivity didn’t move. Then, gradually, organizations that used computers to do fundamentally different things, not just faster versions of the same things, began pulling away from those that hadn’t. By the mid-1990s, the productivity gains from computing were showing up in the data. The lag was roughly a decade.
There are reasons the AI productivity lag could resolve faster. The technology is more capable and more broadly applicable than computing was in its early phases. The pace of deployment is higher. Organizations have more experience navigating technology transitions than they did in the 1980s. And the competitive pressure to actually realize returns, rather than just adopt the tools, is more visible and more immediate.
There are also reasons it could take longer. The organizational redesign required for AI is more complex than the redesign required for computing, because AI is being deployed across more functions simultaneously. The simultaneity problem from the anchor piece in this series applies directly here: organizations are being asked to redesign workflows, manage labor transitions, absorb capital costs, and navigate sector restructuring all at once, on overlapping timelines, with limited organizational bandwidth. Previous technology transitions arrived more sequentially. This one is arriving all at once.
Whether the lag resolves faster or slower than the computing precedent, the mechanism is the same. Organizational redesign is what converts technology adoption into productivity. It hasn’t happened at scale yet. The question is when and how fast it does.
How Productivity Connects to the Other Three Clocks
The productivity trough is where the other three restructurings interact most directly.
Capital is waiting. The infrastructure bet described in the capital piece assumes that returns will materialize on a timeline that justifies the scale of the investment. Those returns require organizational productivity gains, which require workflow redesign, which requires the intangible investment that most organizations have underbudgeted. The productivity trough extends the gap between when the capital was deployed and when it starts generating the returns that justify it.
Labor is bifurcating along the same redesign line. The workers and organizations that are achieving real productivity gains are the ones actively redesigning workflows rather than layering AI on top of existing ones. That distinction, between redesign and overlay, is producing the divergence between the 55% and the 20% in the Stanford data. The labor bifurcation from the previous pieces in this series is, in significant part, a productivity redesign bifurcation.
Sector restructuring is moving fastest in the industries with the simplest workflows to redesign. Software development, financial analysis, legal research: fields where the core work is knowledge-intensive but relatively linear. Manufacturing, healthcare, and education have more complex, more physical, and more regulated workflows. The productivity clock runs at different speeds by sector precisely because the redesign work runs at different speeds.
The productivity restructuring is not an independent variable. It is the output of how well the other three restructurings are being navigated. Where capital is well-deployed, labor is well-positioned, and sector structure is amenable to redesign, productivity gains are showing up. Where any of those conditions is missing, the trough extends.
Two Things to Watch
The productivity clock resolves around two leading indicators worth tracking carefully.
The first is the rate at which organizations move from AI adoption to AI-native workflow redesign. The Stanford data makes clear that adoption and redesign are different decisions, and most organizations have made the first without fully committing to the second. When that changes at scale, the 20% that currently report revenue growth will start moving toward the 66% that are already seeing task-level gains. That shift will show up in enterprise software spending patterns before it shows up in macro productivity data: organizations that are genuinely redesigning workflows need different tools, different implementation support, and different training than organizations simply overlaying AI on existing processes.
The second is whether the macro productivity statistics begin moving before the revenue data fully resolves. If productivity gains appear in GDP and output-per-hour data while enterprise AI revenue is still catching up, it suggests the organizational redesign work is happening and the returns are coming. If the macro data stays flat while individual productivity reports remain strong, the Solow pattern is repeating more precisely than the optimistic case assumes.
The Solow paradox resolved. It just took longer than the technology’s advocates expected, and it required more organizational change than anyone had budgeted for. The AI version of that story is still being written. The data so far suggests we’re in the middle of it, not near the end.
Next in the series: the sector restructuring. Which industries are actually being transformed versus which are being disrupted at the edges, and why the difference matters more than the headlines suggest.

